Project Description:
For the purposes of this exercise, I visualized the sales trends for BigMart, a fictional retail company, which is based in Europe and has operations across multiple countries around the globe. I worked with BigMart's Invoice-wise and Stock-Keeping Unit (SKU)-wise sales data for the year 2011. In this simulated scenario, I was a data analyst in BigMart's Information Technology (IT) team, and my goal was to prepare meaningful charts to showcase the various sales trends for 2011 to the company's top management. I displayed data for key issues pictorially to capture the top management's attention and bring these issues to their consideration. I accomplished this in several steps:
- Data Cleaning: I started by meticulously cleaning the dataset, handling missing values, removing duplicates, and ensuring data consistency to prepare a robust foundation for analysis.
- Visualization: Utilizing Python libraries such as Matplotlib and Seaborn, I created a series of visualizations to illustrate trends and patterns within the sales data. These visualizations ranged from simple line graphs to complex bar charts and pie charts, providing intuitive representations of the data.
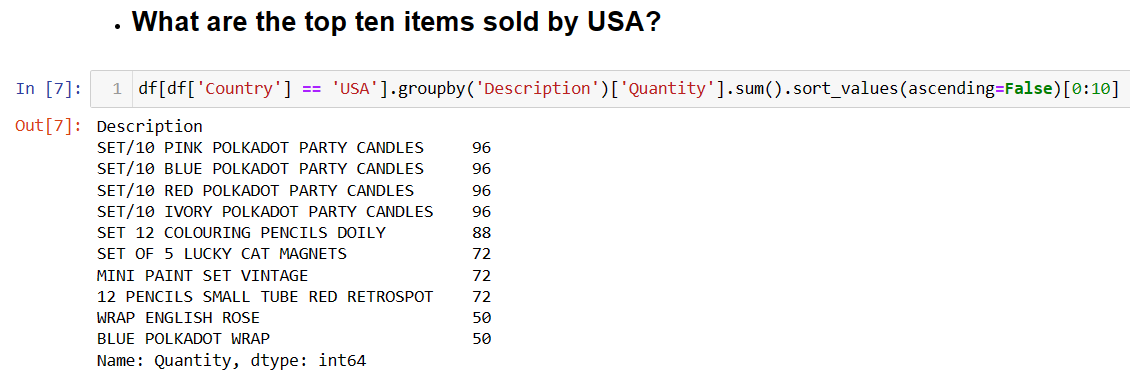
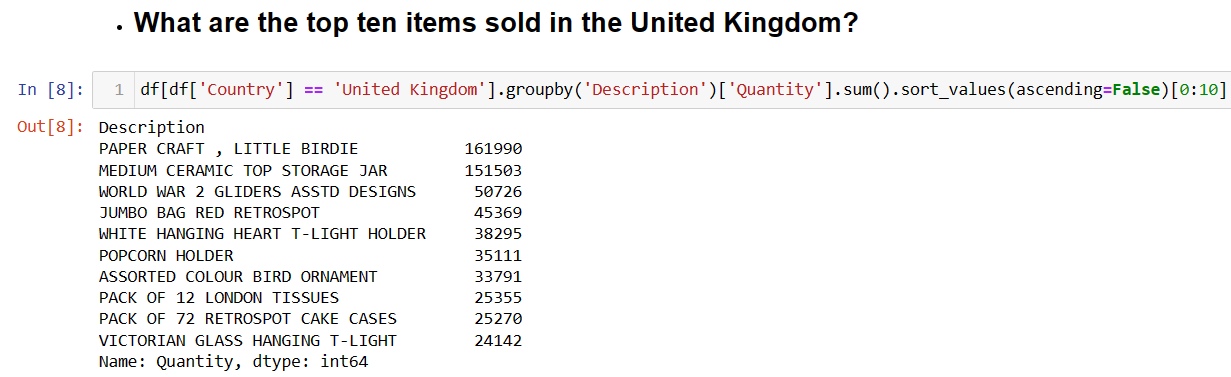
- Analysis: With clean data and compelling visualizations in hand, I delved into the analysis phase, exploring various aspects such as the top ten items sold in particular countries such as the United States and the United Kingdom, the highest- and lowest-performing months in terms of sales, and which countries contributed the most to BigMart's sales.
- GitHub Repository: As a final step, I documented my code, findings, and visualizations in a GitHub repository, making it accessible to the wider community. Leveraging Git/GitHub commands, I ensured version control and collaborative development throughout the project lifecycle.
Through the rigorous analysis of the BigMart 2011 global sales data, several key findings emerged:
- The top 10 items sold in the USA are polka-dot party candles and different stationery such as coloring pencils and paint sets.
- The top 10 items sold in the United Kingdom are more varied, and include different craft objects, holders and cases.
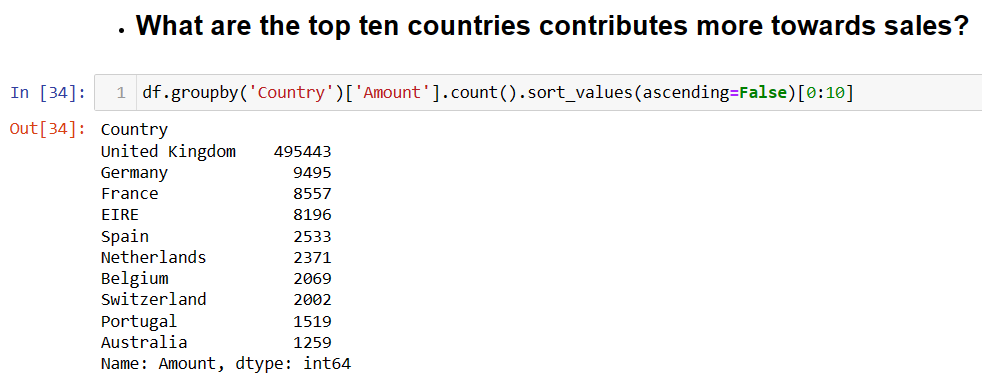
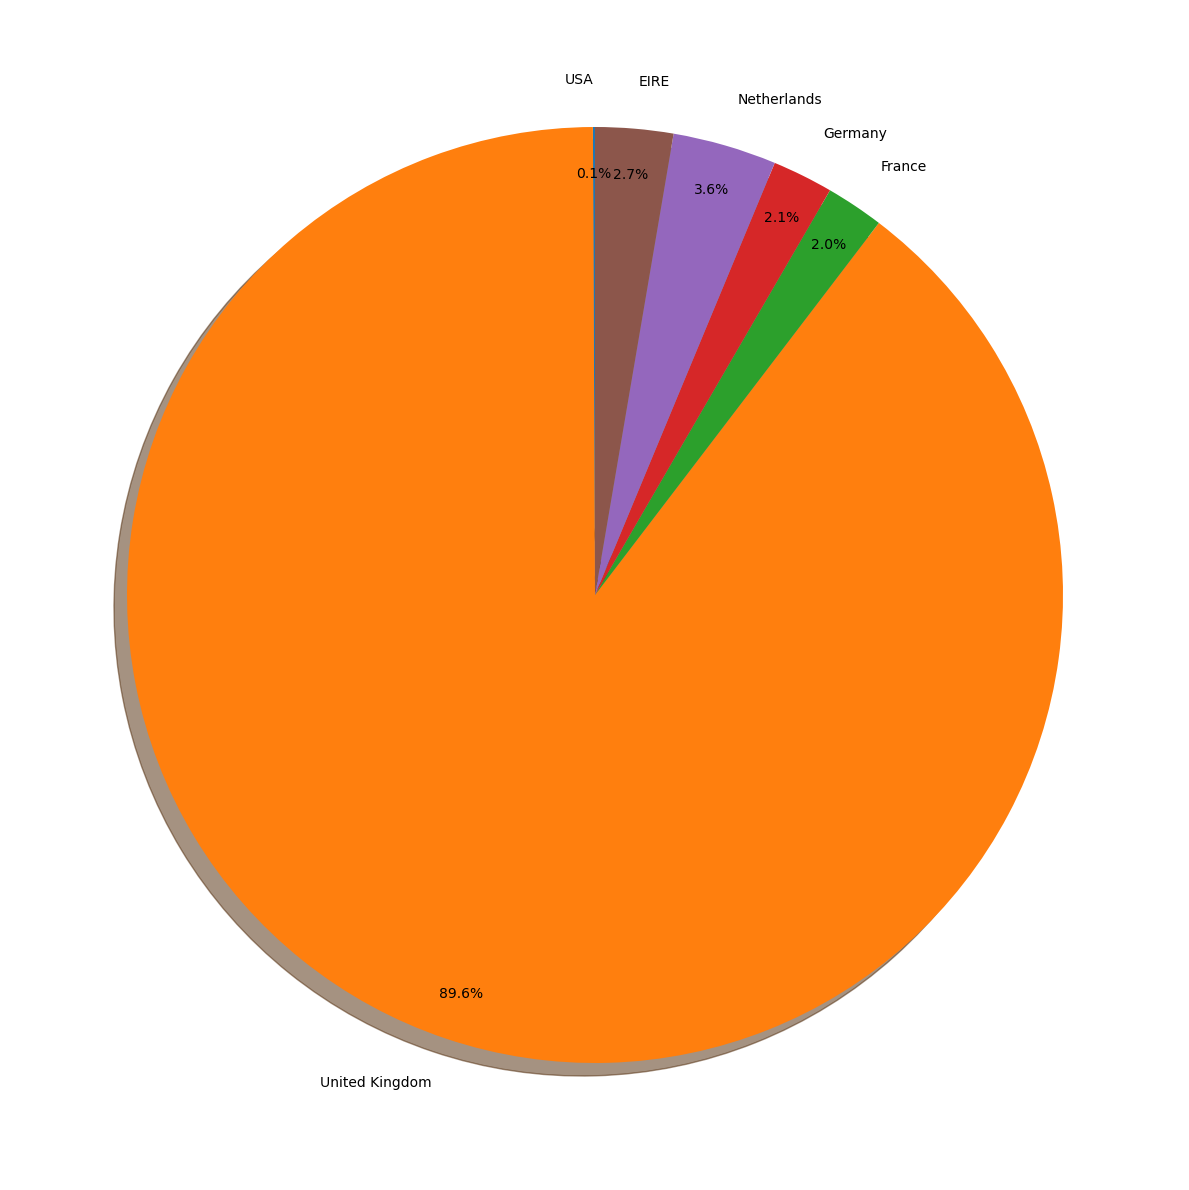
- Among the top 10 countries that contribute the most towards sales, the United Kingdom far exceeds all the others in terms of total amount of revenue, including the second-highest contributor, Germany.
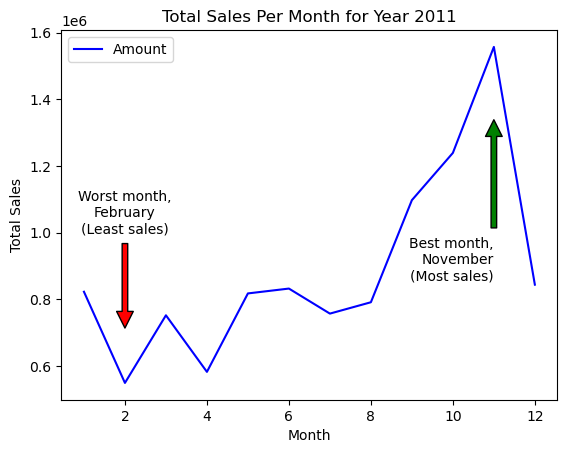
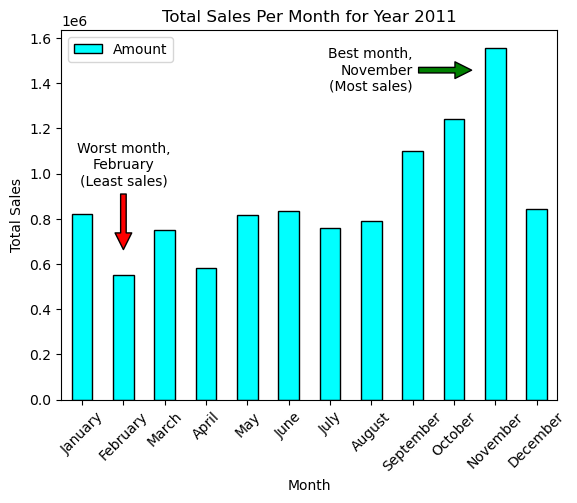
- A yearly analysis of sales shows that November 2011 was the highest-performing month in the year in terms of sales, while February 2011 was the lowest-performing month.
- Among the USA, the United Kingdom, the EIRE (Ireland), the Netherlands, Germany, and France, the United Kingdom far exceeds the rest in terms of total amount of revenue (89.6%), including the second-highest contributor, the Netherlands (3.6%).