Project Description:
The Stack Overflow Annual Developer Survey serves as a treasure trove of information for understanding the dynamics of the developer ecosystem worldwide. With this project, I embarked on a journey to extract meaningful insights from this extensive dataset. The project was structured around several key objectives:
- Data Cleaning: I started by meticulously cleaning the dataset, handling missing values, removing duplicates, and ensuring data consistency to prepare a robust foundation for analysis.
- Visualization: Utilizing Python libraries such as Matplotlib and Seaborn, I created a series of visualizations to illustrate trends and patterns within the developer community. These visualizations ranged from simple bar charts to complex heatmaps, providing intuitive representations of the data.
- Analysis: With clean data and compelling visualizations in hand, I delved into the analysis phase, exploring various aspects such as average developer salaries per country, the prevalence of Python usage, preferred resources for problem-solving, and the correlation between developer salaries and age/gender.
- GitHub Repository: As a final step, I documented my code, findings, and visualizations in a GitHub repository, making it accessible to the wider community. Leveraging Git/GitHub commands, I ensured version control and collaborative development throughout the project lifecycle.
Through the rigorous analysis of the Stack Overflow Annual Developer Survey, several key findings emerged:
- Average Salary by Country: The analysis revealed significant disparities in developer salaries across different countries, with certain regions showing higher remuneration for developers. Among the United States, the United Kingdom, France, Germany, Canada, and India, the United States provided slightly higher median salaries for developers than the remaining countries, whose median salaries are roughly in the same range as each other. The only exception is India, whose median salary is significantly lower than the rest.
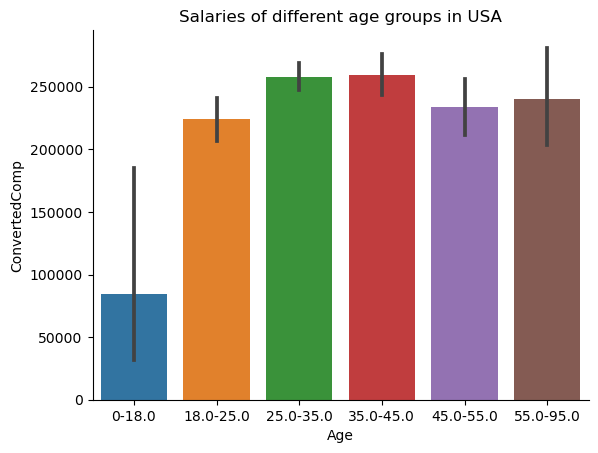
- Salary by Age Group: There is a trend in the salary with respect to age group, with individuals of age 18 years and younger obtaining the lowest salaries, and individuals aged 35 to 45 years earning the highest salaries.
- Problem-Solving Resources: Developers predominantly relied on online forums, documentation, and peer networks for troubleshooting and problem-solving, underscoring the importance of community support in the developer ecosystem.
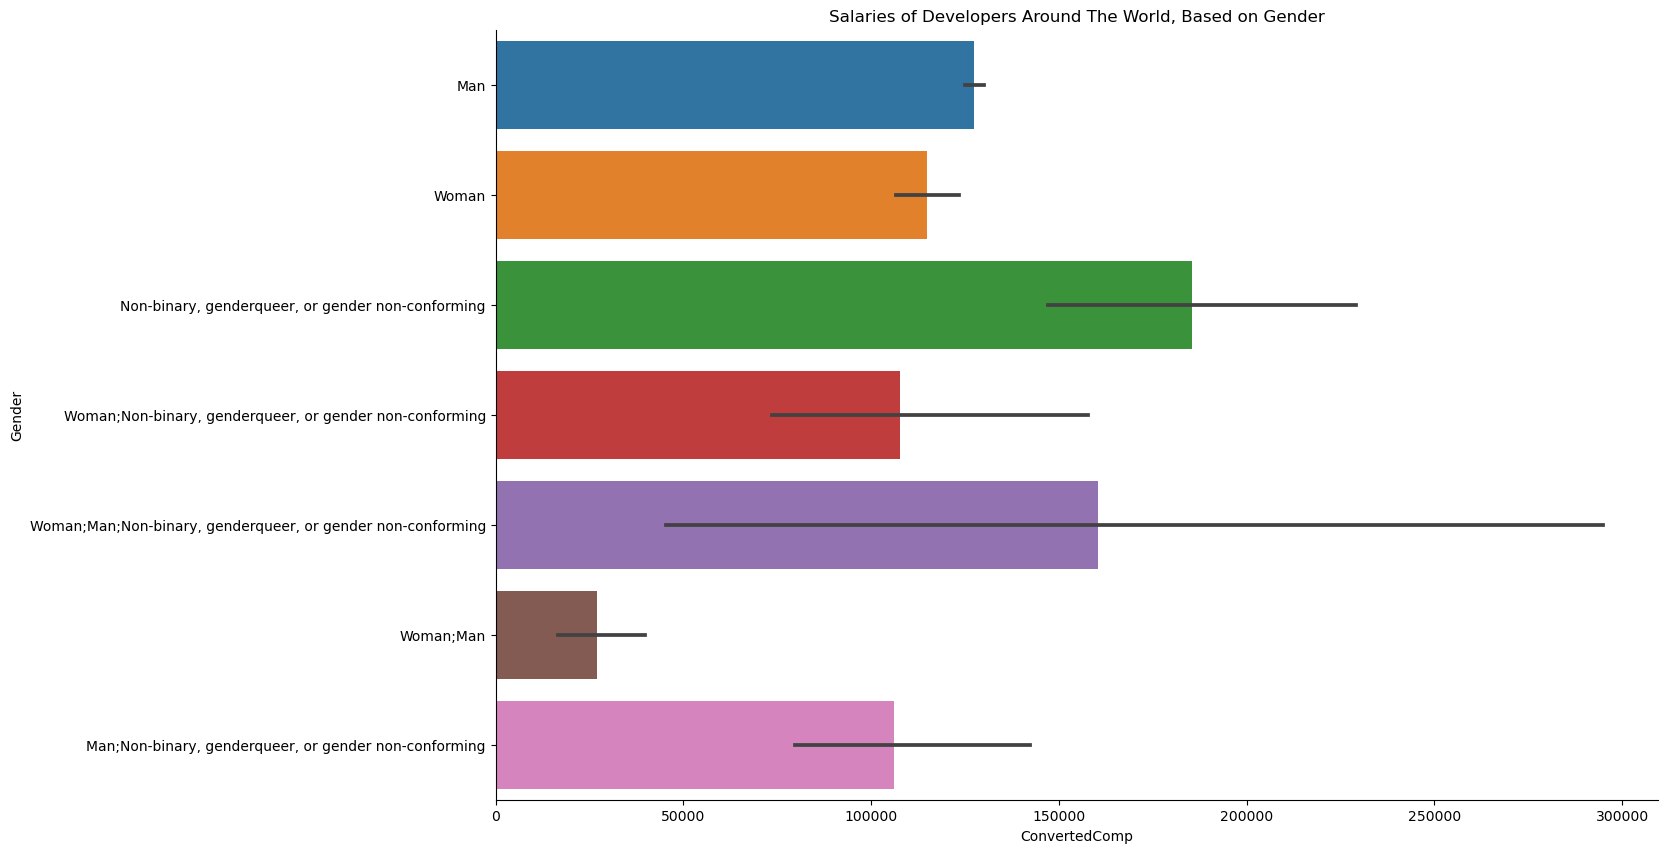
- Developer Salaries vs. Age/Gender: Analysis showcased nuanced trends in developer salaries concerning age and gender, offering insights into potential factors influencing compensation disparities within the industry.